
Scale Theory
Complex business thinking, made precise and teachable.

Project overview
Scale Theory is a high-contrast course system for founders moving from personal expertise to a scalable company.
The challenge
The curriculum relied on interconnected models, operational maps and financial decision points that had to remain legible across print, slides and webinars.
Visual direction
Carbon black, paper white and electric cobalt create a decisive visual language inspired by strategy rooms and technical publishing.
The system
Every diagram is built from the same geometry, allowing the programme to scale from workbook pages to keynote-size presentations.
Context
A business programme for founders who need to see the system behind their expertise.
Scale Theory is designed for the move from a founder-dependent practice to a company with clearer processes, roles and economics. Its curriculum covers operating models, offers, teams, funnels, financial decisions and control points. The design had to carry genuinely dense thinking without reducing it to a sequence of dramatic quotes or oversimplified growth diagrams.
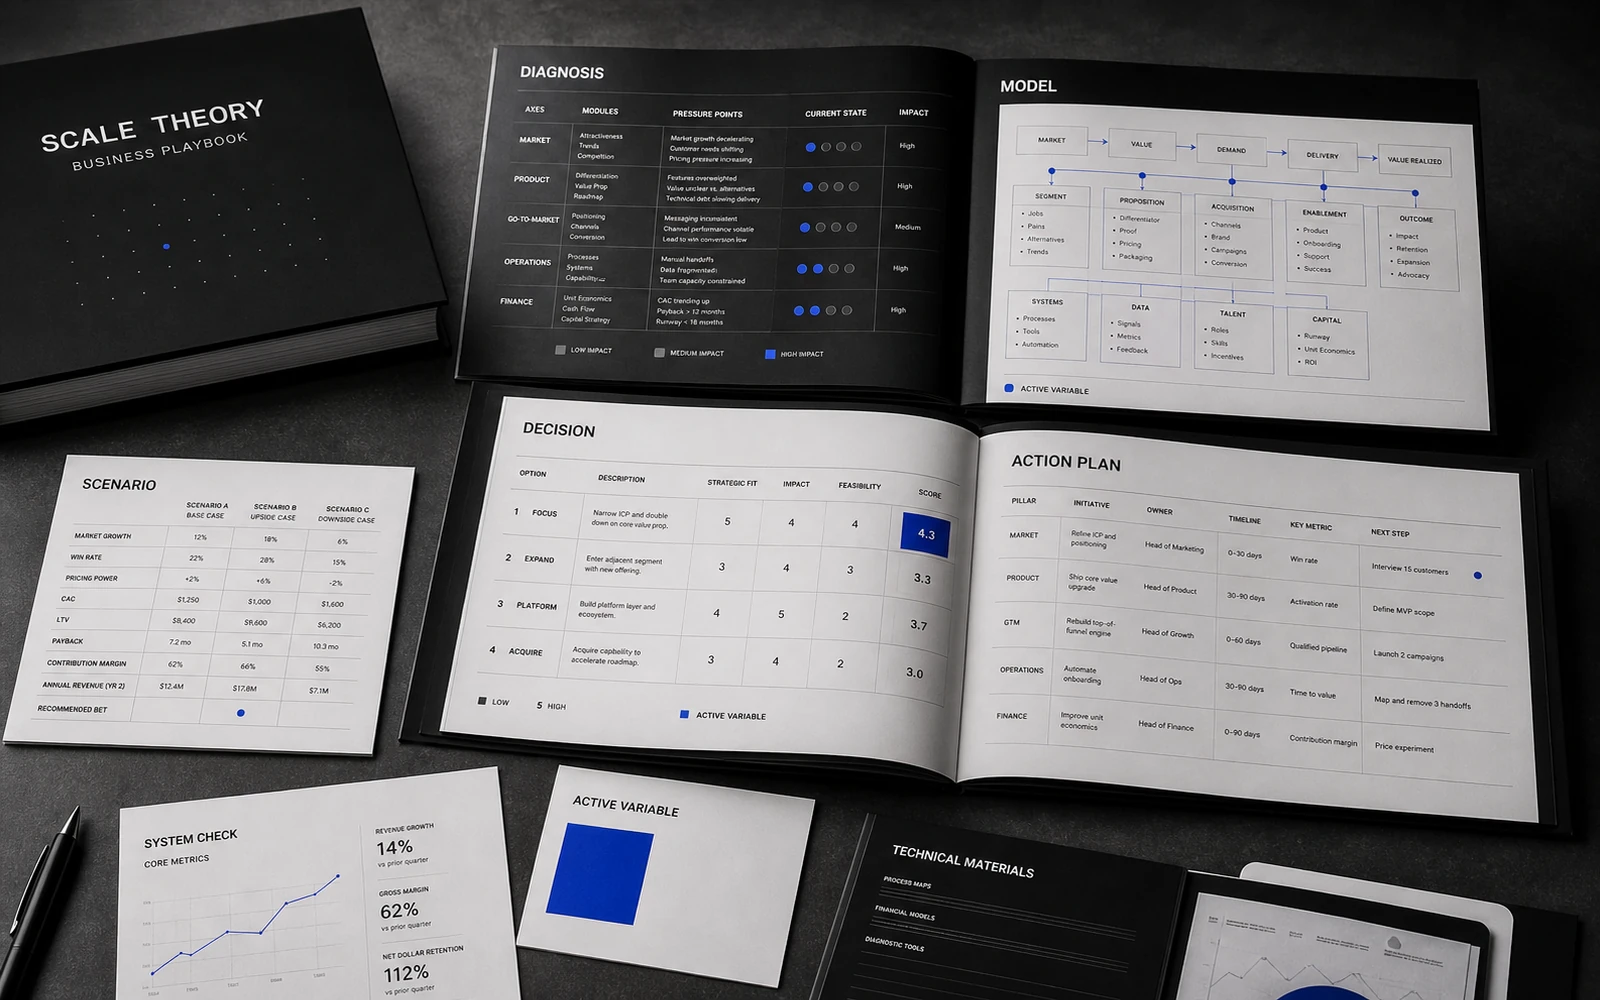
The author supplied the complete methodology, approved copy, tables and sketches of proprietary models. Some explained sequences; others mapped dependencies or decision scenarios. During the design audit, we grouped the supplied material by visual need and established rules for showing processes, comparisons, maps and decision points without changing the substance of the programme.
Visual direction
A visual language with a clear point of view.
Editorial serif
+ precise grotesk
Creative premise
A strategy room in which every decision has coordinates.
The visual idea draws on the working environment of a serious strategy session: dark screens, technical publishing, markers, tables and large maps that make the whole business visible at once. It is not a generic technology aesthetic. It reflects a programme in which decisions are tested against relationships, numbers and the ability of a system to function beyond the founder’s constant involvement.
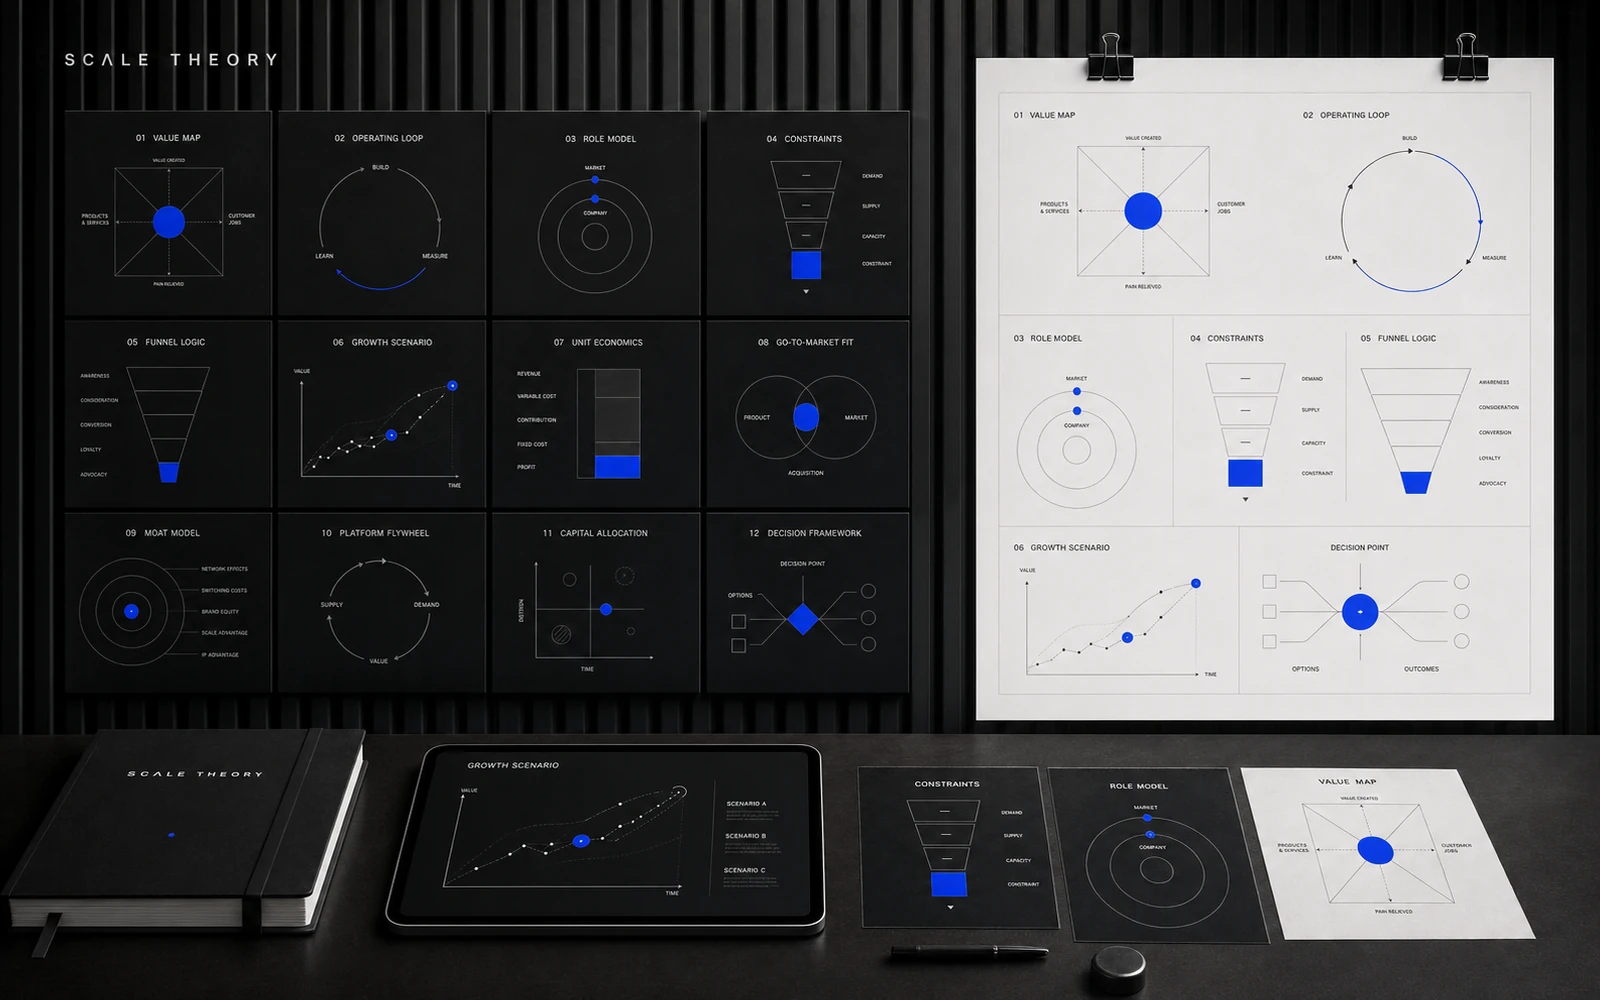
The name acknowledges that scale is not one universal formula. The course contains several interconnected models, and the design needs to reveal that relationship. Geometry, axes, modules and pressure points recur across diagrams so that every framework appears to belong to the same body of thought rather than another slide with an unrelated set of arrows.
Visual system
Carbon black, paper white and electric cobalt create a language of precision.
High contrast helps control complexity. Dark fields hold major models and strategic conclusions; light pages support reading, tables and written work. Electric cobalt marks the active variable, selected scenario or decision point. It is not a decorative flash of colour: its role remains consistent across the playbook, slides, webinar and sales-page graphics.
A grotesk with confident numerals carries tables and metadata, while larger statements establish the scale of an idea. The grid can hold wide maps, vertical processes and compact comparisons. Architectural and technical imagery sets the atmosphere without illustrating “business” literally. The result is decisive enough for the audience and still practical in a working session.
Visual organisation of the materials
The business playbook makes complex models easier to read and use.
We developed layouts around the existing material in the approved playbook: diagnosis, model explanation, worked examples, scenario comparisons, figures and action planning. Visual hierarchy distinguishes information to understand from a decision to record. Dense tables receive consistent headings, units and levels of emphasis, making them easier to scan without simplifying the underlying business content.
Twelve proprietary models arrived as authored content and working sketches. We translated them into a coherent diagram library. Value maps, operating loops, role models, constraints, funnel logic and growth scenarios retain their original reasoning while sharing graphic rules and responsive versions for the playbook, lesson presentations and campaign assets.
Understand
Apply

Learning experience
One model moves clearly from explanation to decision.
Each established framework appears at different levels of density. A webinar slide introduces the principle, a lesson deck reveals it in stages, the playbook contains the full annotated model and a worksheet provides space for the participant’s own figures. The visual language stays stable, allowing the complexity to remain in the thinking rather than in the interface.
The slide system avoids shrinking tables onto a screen. It breaks an argument into steps, highlights one dependency and returns to the full map at the end of the section. When participants move into the exercise, the form is already familiar. The same system gives the instructor a reliable visual structure for live explanations and future examples.
Launch system
The campaign demonstrates the programme’s way of thinking, not merely the promise of growth.
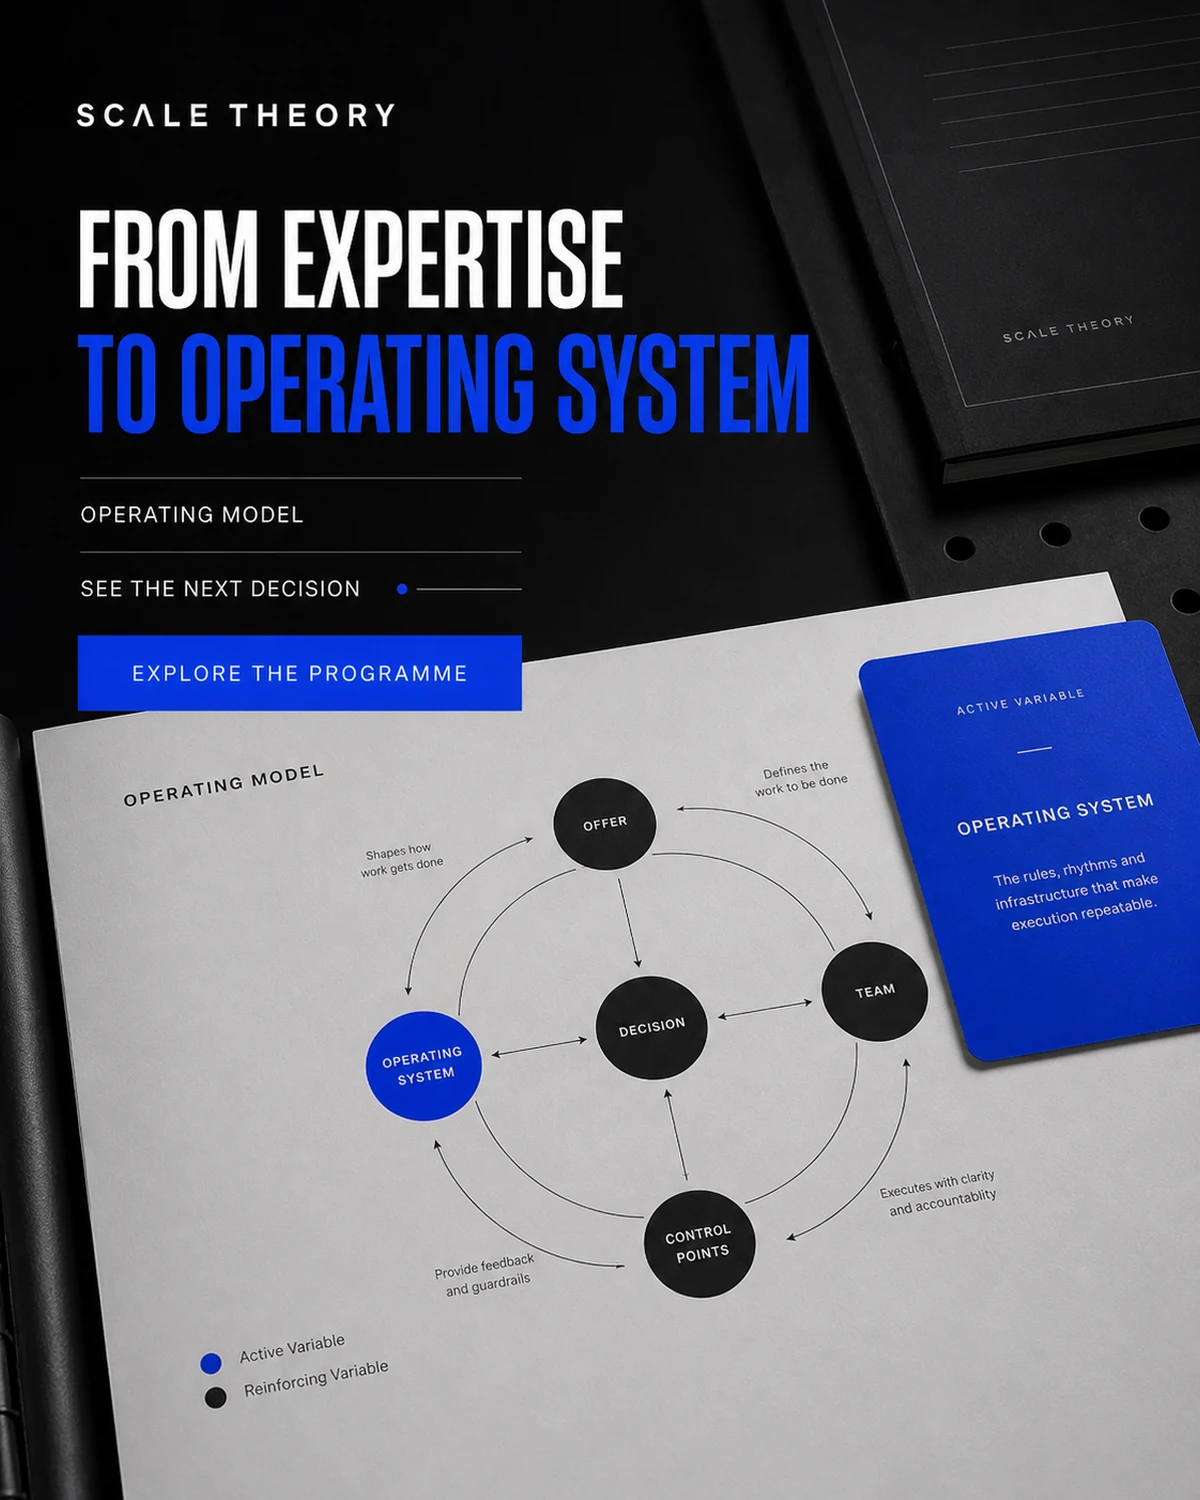
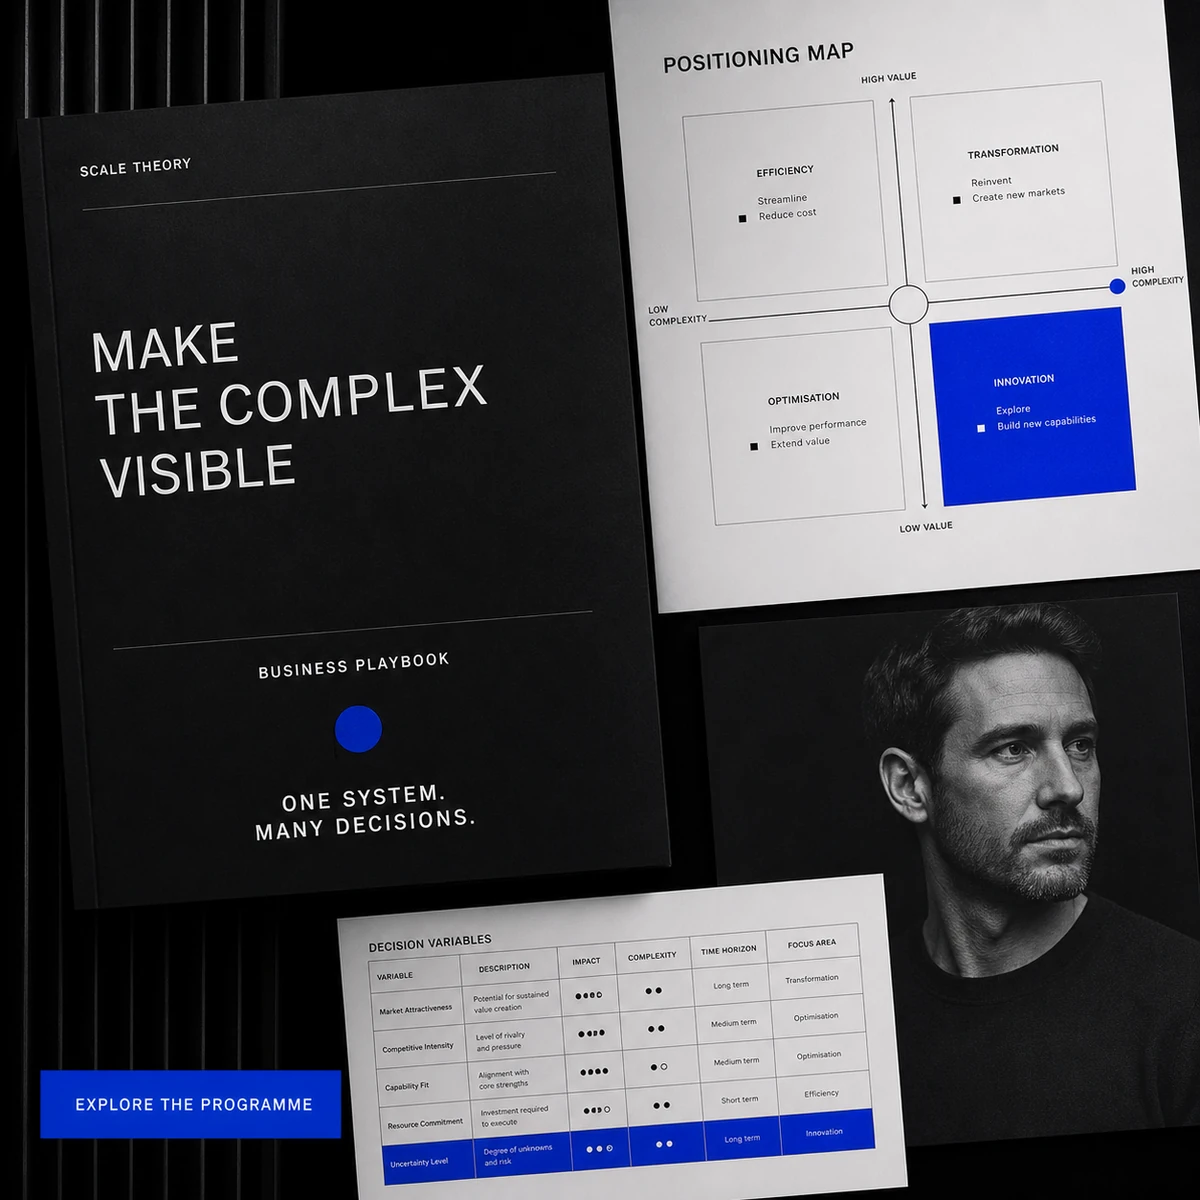
Sales-page graphics and paid media use fragments of real models, diagnostic questions and contrasts between fragmented and systematic operations. The creative does not rely on a random upward graph as proof. It shows how Scale Theory turns a complicated situation into variables, relationships and decisions that can be examined.
The webinar deck becomes the bridge between content and offer. It first helps founders recognise a constraint, then reveals the programme’s visual logic and only afterwards introduces the full product. Cobalt markers, diagram geometry and the dark visual field continue through advertising and sales graphics, so the learning environment feels familiar immediately after enrolment.

 Story 9:16
 Social 4:5
 Campaign 1:1
 Webinar 16:9
System deliverables
Business playbook
12 proprietary diagrams
Course slide system
Webinar deck
Sales-page graphics
Paid media kit
What the system enables
Scale Theory gains a visual infrastructure for complex content and future launches.
The business playbook, twelve proprietary diagrams, course slides, webinar deck, sales graphics and paid media kit now operate as one system. The same authored model can appear at several levels of detail without losing its relationships. Participants gain a clearer path through the material; the instructor gains a consistent way to present the method.
A new process, financial example or team scenario can be expressed through established components. The system does not force every subject into one template; it provides rules for different kinds of complexity. That allows the programme to evolve with the author’s methodology while remaining recognisable in teaching, sales and future cohorts.